
Official websites use .gov
A
.gov
website belongs to an official government organization in the
United States.
Secure .gov websites use HTTPS
A
lock
(
) or
https://
means you’ve safely connected to the .gov website. Share sensitive
information only on official, secure websites.

Electronic Public Health Reporting Among Non-Federal Acute Care Hospitals, 2024
No. 78 | July 2025
Improving seamless, secure public health data exchange between health care and public health remains a key goal of data modernization efforts aimed at ensuring public health agencies (PHAs) have access to timely, accurate data needed to inform public health decision-making. In 2023, the Centers for Disease Control & Prevention (CDC) launched the Public Health Data Strategy (PHDS) which aims to address gaps in core public health data streams, remove barriers to exchange, and improve the availability of data to inform public health response and improve population health1. Beginning in January 2022, eligible hospitals and critical access hospitals that participate in the Centers for Medicare & Medicaid Services (CMS) Medicare Promoting Interoperability (PI) Program were required to electronically submit data to PHAs for syndromic surveillance, immunization registry, electronic lab results, and electronic case reporting. In prior years, hospitals were required to report three or fewer measures of their choice. Beginning January 1, 2024, hospitals were also required to report antimicrobial use and resistance (AUR) data, while public health and clinical data registry reporting qualified for bonus points2. Hospital capacity reporting requirements, which began during the COVID-19 pandemic and became voluntary in May 2024, were reinstated on November 1, 20243. This data brief uses nationally representative survey data from the 2024 American Hospital Association (AHA) Information Technology (IT) supplement to describe non-federal acute care hospitals’ engagement in electronic public health reporting, methods and processes used for submission, and ongoing challenges to reporting to PHAs.
Highlights
- In 2024, nearly all hospitals were engaged in electronic public health reporting for core (required) data types: immunization, syndromic surveillance, laboratory, and case reporting.
- Most hospitals submitted data directly through their electronic health record (EHR) system and used fully or primarily automated processes to submit data for core data types.
- While EHRs were the most common method used to submit data for reporting, portals and flat files and a mix of automated and manual methods were still commonly used for optional reporting types (e.g., public health and clinical data registry reporting).
- Hospital engagement in electronic public health reporting varied by hospital characteristics. Small, rural, independent, and critical access hospitals were engaged in fewer types of electronic public health reporting on average, compared to their counterparts.
- Despite marked progress towards public health data interoperability, more than 8 in 10 hospitals experienced at least one challenge to electronic public health reporting in 2024.
In 2024, nearly all hospitals were engaged in electronic public health reporting for core data types: immunization, syndromic surveillance, lab, and case.
Findings
- Rates of electronic public health reporting were highest for core data types—immunization, syndromic surveillance, lab, and case—that have all been required by the Medicare PI Program since 2022.
- In 2024, nearly three-quarters of hospitals were electronically reporting antimicrobial use and resistance (AUR) data shortly after it became required in 2024.
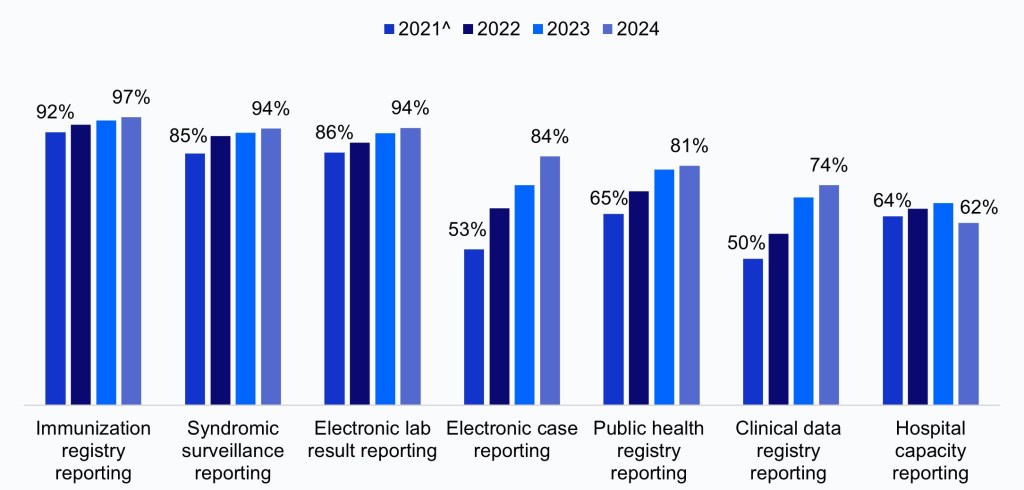
- Rates of electronic public health reporting have increased over time for both required and optional reporting types (i.e., public health and clinical data registry reporting) (Appendix Figure A1).
Figure 1: Percent of non-federal acute care hospitals engaged in electronic public health reporting, 2024.
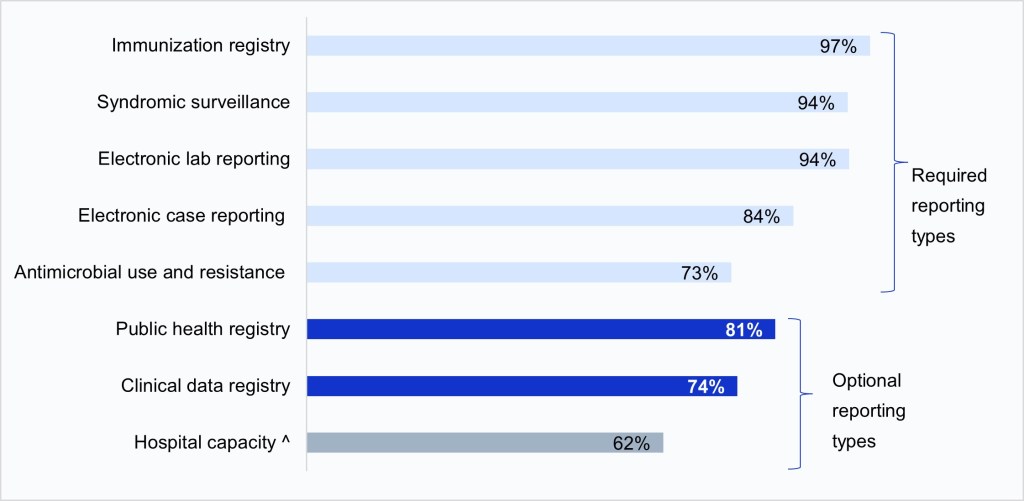
Notes: Electronic public health reporting was defined as submitting data via electronic health record, health information exchange, portal, or flat files. Missing values were excluded from the denominator. Clinical data registry reporting refers to hospitals’ reporting to registries that record information about patients’ health status and care; these registries typically focus on a specific disease or condition and primarily help inform clinical decision making. Clinical data registry reporting is included in this brief because it is part of the “Public Health and Clinical Data Exchange” performance objective in the CMS PI program but is considered separate from public health reporting. ^Hospital capacity reporting became optional in May 2024 and then required again in November 2024, after the fielding of the 2024 AHA IT Supplement. Therefore, hospital capacity reporting was considered “optional” during this survey period.
EHRs were the most common method used to submit data for electronic public health reporting.
Findings
- In 2024, most hospitals submitted data directly through their EHR for core data types, ranging from 71% for electronic case reporting to 86% for immunization registry reporting.
- Health information exchange (HIE) organizations were also commonly used to submit data electronically, especially for core data types; however, the use of HIEs for reporting varied substantially by state (Appendix Figure A2).
- While about half of hospitals submitted data directly from their EHR for public health registry, clinical data registry, and AUR reporting, hospitals also commonly reported using portals or flat files to submit data electronically. However, methods used varied by hospital characteristics (Appendix Table A1).
- While over a third of hospitals reported submitting hospital capacity data via portal, a similar share indicated they were not electronically submitting data (12%) or didn’t know whether or how data were submitted (27%).
Table 1: Methods used by non-federal acute care hospitals to submit data electronically for public health reporting, 2024.
| Report electronically via: | ||||||
|---|---|---|---|---|---|---|
| Directly from EHR | HIE | Portal | Flat files | No electronic reporting | Don’t know | |
| Immunization registry | 86% | 19% | 14% | 15% | 1% | 1% |
| Syndromic surveillance | 82% | 18% | 11% | 8% | 3% | 3% |
| Electronic lab reporting | 81% | 19% | 13% | 10% | 2% | 4% |
| Electronic case reporting | 71% | 16% | 12% | 9% | 8% | 7% |
| Public health registry | 49% | 16% | 32% | 21% | 9% | 10% |
| Antimicrobial use and resistance | 47% | 8% | 32% | 16% | 12% | 15% |
| Clinical data registry | 45% | 12% | 35% | 25% | 9% | 16% |
| Hospital capacity | 21% | 5% | 37% | 17% | 12% | 27% |
Notes: Missing values were excluded from the denominator.
Hospitals’ engagement in electronic public health reporting varied by hospital characteristics.
Findings
- In 2024, hospitals were engaged in electronic public health reporting for about 6 out of 8 measured reporting types, on average, and nearly all core reporting types (3.5 out of 4).
- Small, rural, independent and critical access hospitals were engaged in fewer types of electronic public health reporting on average, compared to medium and large, urban, system-affiliated, and non-critical access hospitals.
- Hospitals with the market leading EHR vendor engaged in more types of electronic public health reporting compared to hospitals utilizing non-market leading vendors (6.7 vs. 5.8 on average).
Table 2: Mean number of public health reporting types, by hospital characteristics, 2024.
| Hospital Characteristics | N | Mean number of reporting types (out of 8) | Mean number of core reporting types (out of 4) |
|---|---|---|---|
| All hospitals | 6.3 | 3.5 | |
| Bed Size | |||
| Small < 100 (ref) | 1,060 | 6.1 | 3.3 |
| Medium 100 – 399 | 891 | 6.4* | 3.7* |
| Large > 400 | 299 | 6.8* | 3.8* |
| Ownership | |||
| Non-profit | 1,600 | 6.7* | 3.6* |
| For-profit (ref) | 239 | 5.1 | 3.4 |
| Government | 411 | 5.9* | 3.2 |
| Location | |||
| Rural | 840 | 6.1 | 3.3 |
| Urban | 1,410 | 6.4* | 3.6* |
| Critical Access | |||
| Yes | 631 | 6.0 | 3.3 |
| No | 1,619 | 6.4* | 3.6* |
| System Affiliation | |||
| Independent | 546 | 5.9 | 3.1 |
| System Member | 1,704 | 6.5* | 3.7* |
| EHR Vendor | |||
| All other vendors | 989 | 5.8 | 3.3 |
| Market leading vendor | 1,257 | 6.7* | 3.7* |
Notes: *Indicates statistically significant difference relative to the reference group (P<.05).
In 2024, fully or primarily automated processes were predominantly used to submit public health data electronically for the core data types.
Findings
- Fully or primarily automated processes were most commonly used to submit data electronically for core data types: immunization (84%), syndromic (82%), lab (78%) and case (61%) reporting.
- Newly required and optional reporting for AUR, public health registry, clincal data registry, and hospital capacity reporting primarily occurred through a mix of automated and manual processes. However, about one-third of hospital continue to use fully or primarily manual processes to submit data for hospital capacity reporting.
Figure 2: Processes used to submit data electronically for public health reporting among non-federal acute care hospitals, 2024.
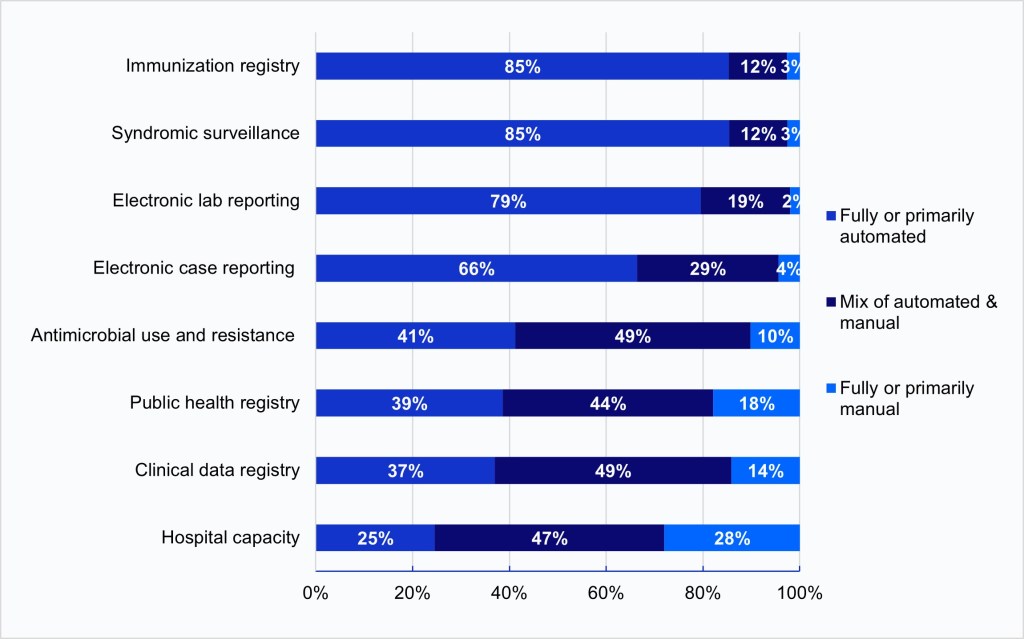
Notes: Hospitals were asked whether they used automated (e.g., EHR generated data sent electronically/automatically to the public health agency), manual (e.g., chart abstraction with data faxed or re-input into a portal), or a mix of both types of processes (e.g., files electronically generated from the EHR, but manual steps required to transmit to public health agency) to transmit data for public health reporting. Responses were limited to hospitals engaged in electronic public health reporting (Figure 1). Missing and don’t know responses were excluded from the denominator.
More than half of hospitals cited the technical complexity of interfaces, transmission, or data submission as a challenge to public health reporting in 2024.
Findings
- In 2024, the technical complexity of interfaces, transmission, or submission processes (55%) and hospitals’ perception that PHAs lack the capacity to electronically receive information (50%) were the most common challenges to electronic public health reporting experienced by hospitals overall. However, rates varied by reporting type (Appendix Table A2).
- A third of hospitals reported experiencing onboarding and cost related challenges for at least one reporting type, while a quarter of hospitals reported difficulty extracting relevant information from the EHR.
- Few hospitals cited the use of different vocabulary standards than the PHA (14%) and their lack of capacity to send information (14%) as barriers to electronic reporting. Only 19% of hospitals reported experiencing no major challenges for any reporting type.
Figure 3: Percent of hospitals that reported specific challenges to electronic public health reporting for at least one reporting type, 2024.
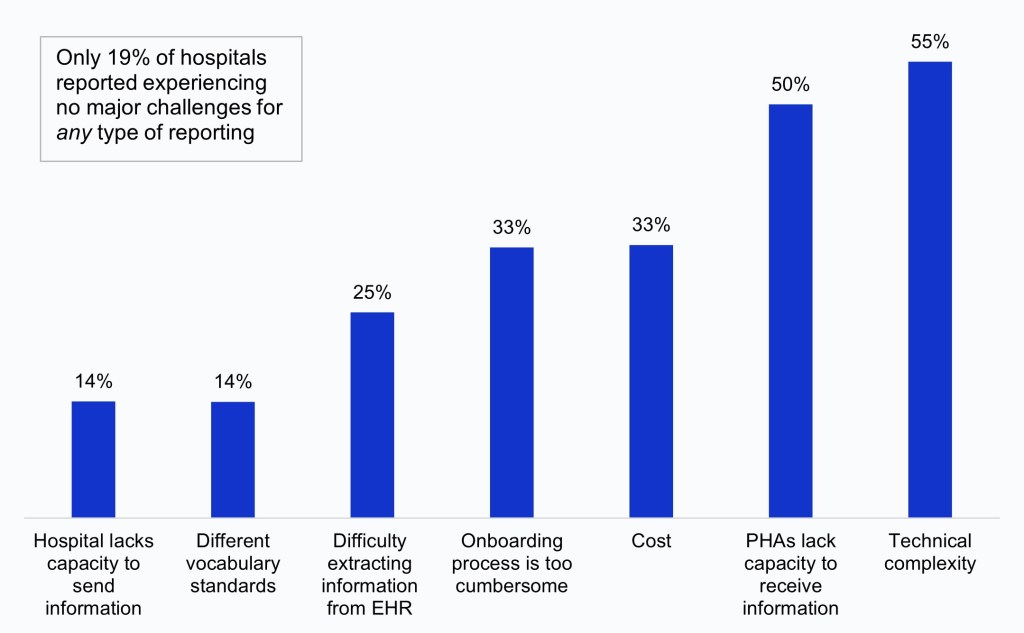
Notes: Figure labels are a short-hand description of public health reporting challenges. A full description of challenges is available in a Challenges Key below Appendix Table A2. Values were excluded from the denominator if missing across all reporting types.
More than 8 in 10 hospitals reported at least one challenge to electronic public health reporting in 2024.
Findings
- Most hospitals (81%) reported at least one challenge to electronic public health reporting in 2024. Hospitals that reported experiencing at least one challenge reported about 3 challenges (out of 7) on average.
- Electronic public health reporting challenges were highest for electronic case reporting (59%) and AUR reporting (57%), and lowest for electronic lab reporting (48%) and hospital capacity reporting (46%).
- The number of challenges experienced did not vary widely by reporting type (ranging from 1.7 for hospital capacity to 2.3 for syndromic surveillance).
Table 3: Percent of hospitals that reported at least one challenge to electronic public health reporting for each reporting type and the mean number of challenges, 2024
| Reporting types | At least one challenge | Mean No.(Out of 7 challenges) |
|---|---|---|
| All reporting types | 81% | 2.8 |
| Electronic case reporting | 59% | 2.1 |
| Antimicrobial use and resistance | 57% | 1.8 |
| Clinical data registry | 53% | 1.9 |
| Syndromic surveillance | 51% | 2.3 |
| Public health registry | 50% | 1.9 |
| Immunization registry | 49% | 1.9 |
| Electronic lab reporting | 48% | 1.8 |
| Hospital capacity | 46% |
Notes: Mean (out of 7) = Mean number of challenges (out of 7 possible challenges) experienced by hospitals that reported at least one challenge
Summary
In 2024, nearly all non-federal acute care hospitals were engaged in electronic public health reporting. Reporting rates have increased over time for both required and optional reporting types(Figure 1, Appendix Figure A1)4. Rates were highest for core data types—immunization (97%), syndromic surveillance (94%), and lab reporting (94%)—that have long been required for eligible hospitals and critical access hospitals participating in CMS’s PI Program. Rates of electronic case reporting have increased substantially since reporting on this measure became required in the PI program in 2022, increasing from 53% in 2021 to 84% in 2024. Additionally, about three-quarters of hospitals were electronically reporting AUR data shortly after it became required in January 2024. Hospital engagement in public health and clinical data registry reporting, which are not required under the PI program but qualify for bonus points, also increased significantly between 2021 and 2024 (from 65% to 81% and 50% to 74%, respectively). Reporting rates were lowest for hospital capacity, likely due in part to changes to the requirement for this reporting type during the survey period. Rates of hospital capacity reporting were slightly lower during the optional reporting period in 2024 compared to the 2023 rates, however, rates will likely rebound due to the reinstated requirement as of November 1, 2024.
EHRs were the most common method used to submit data for electronic public health reporting in 2024, with most hospitals submitting data directly through their EHR for core reporting types. HIEs were the next most common method used to submit data for core reporting types, although the use of HIEs for any type of reporting varied substantially by state (Appendix Figure A2). Portals and flat files were more commonly used for optional and newly required reporting types: about one-third of hospitals used portals to submit data for AUR, public health registry, clinical data registry, and hospital capacity reporting. However, a similar share of hospitals reported that they were not electronically submitting hospital capacity data or did not know how data were submitted. Methods used for reporting also varied significantly by hospital characteristics, even for core data types that hospitals are required to report (Appendix Table A1). Small, rural, independent, critical access hospitals and those not using the leading EHR vendor by market share had significantly lower rates of submitting data directly through the EHR for core reporting types compared to large, urban, system-affiliated, non-critical access hospitals and those using the market leading vendor.
In 2024, most hospitals used fully or primarily automated processes to submit public health data electronically for core data types, and about half of hospitals used a mix of automated and manual processes to submit data for optional and newly required data types. Automated reporting is mutually beneficial for health care and public health because it reduces the burden of reporting for providers while increasing the timeliness and accuracy of reporting to PHAs. While hospitals’ adoption of automated reporting was likely driven by incentives created through the CMS PI program, the CDC’s Data Modernization Initiative (DMI) and COVID-19 related investments, including those that align with key goals of the CDC’s PHDS, haveaimed to strengthen the core of public health data and further accelerate automated solutions to support public health investigations 2, 5. Automated electronic case reporting (eCR), for example, has rapidly expanded over the last few years, improving the quality and efficiency of case reporting to PHAs5. While automated reporting holds the greatest promise for improving the timeliness, completeness, and accuracy of reporting without added burden6, other electronic methods (such as web-based portals) can also improve reporting processes and data quality for hospitals without the resources or capacity to adopt eCR or ELR, which are more costly to implement and maintain7. Continued investment in streamlining reporting processes—such as improvements to EHRs and promoting standards adoption to facilitate data interoperability—may help encourage more hospitals to engage in automated, electronic reporting to PHAs.
Despite significant improvements in electronic public health reporting over the years, significant perceived challenges persist. In 2024, most hospitals (81%) reported at least one challenge to electronic public health reporting, with about 3 challenges (out of 7) reported on average. Challenges were highest for electronic case reporting (59%) and AUR reporting (57%), potentially due to these reporting types becoming required by the CMS PI program in 2022 and 2024, respectively, and hospitals may have experienced technical, onboarding, or cost-related challenges trying to comply with new requirements. Like previous years, the most common challenges reported by hospitals overall were the technical complexity of interfaces, transmission, or submission processes (55%) and the perception that PHAs lack the capacity to electronically receive information (50%), although rates varied by reporting type (Appendix Table A2). While these challenges only reflect the perspective of hospitals, similar challenges related to staffing shortages, limited capacity, outdated IT infrastructure, and inadequate funding have been identified as barriers by state public health officials7. Together, these findings highlight the importance of continuing efforts to identify common challenges to public health data exchange that will help drive solutions that ease the burden of reporting, collecting, analyzing, and using electronic data for both health care providers and PHAs.
Using the latest nationally representative survey data on U.S. hospitals, our findings demonstrate high engagement in electronic public health reporting among non-federal acute care hospitals in 2024. However, the COVID-19 pandemic exposed gaps in our public health data infrastructure that continue to hinder the use of electronic, standardized methods of data sharing between health care and public health5. There are several ongoing federal efforts to address these challenges. The aforementioned goals of the CDC’s PHDS aim to address barriers to public health data interoperability and increase insights to inform public health response, with a focus on automated solutions that reduce burden for reporters while improving data quality for public health. Complementary efforts to improve standards-based exchange include ASTP/ONC’s Health IT Certification Program—which requires developers of certified health IT to enable users to electronically send standardized health data to PHAs—and the United States Core Data for Interoperability (USCDI+) Public Health Initiative—which is working towards a standardized set of data elements to support public health uses cases and can help improve the availability of critical data needed to support public health action. Promoting the adoption of common data and system standards, particularly Fast Healthcare Interoperability Resources® (FHIR®)-based exchange, can facilitate automated reporting, help address issues related to the technical complexity of interfaces, transmission, or data submission processes, and promote bi-directional exchange with PHAs5. Furthermore, the Trusted Exchange Framework and Common AgreementTM (TEFCATM) may help streamline public health data interoperability by enabling the secure sharing of information across state and jurisdictional lines. Continued public-private collaboration and coordination is critical to dissolving barriers to public health data exchange and promoting the seamless flow of information between health care and public health.
Definitions
Critical Access Hospital: Hospitals with less than 25 beds and at least 35 miles away from another general or critical access hospital.
Large hospital: Non-federal acute care hospitals of bed sizes of 400 or more.
Market leading EHR vendor: Market leading EHR vendor by market share. The market share is based off hospital responses to the 2024 survey.
Medium hospital: Non-federal acute care hospitals of bed sizes of 100-399.
Non-federal acute care hospital: Hospitals that meet the following criteria: acute care general medical and surgical, children’s general, and cancer hospitals owned by private/not-for-profit, investor-owned/for-profit, or state/local government and located within the 50 states and District of Columbia.
Public Health Agency (PHA): state and local public health agencies are organizations whose primary function is to promote and maintain population health through programs and services that support the health and well-being of individuals and their communities.
Rural hospital: Hospitals located in a non-metropolitan statistical area.
Small hospital: Non-federal acute care hospitals of bed sizes of 100 or less.
System Affiliated Hospital: A system is defined as either a multi-hospital or a diversified single hospital system. A multi-hospital system is two or more hospitals owned, leased, sponsored, or contract managed by a central organization. Single, freestanding hospitals may be categorized as a system by bringing into membership three or more, and at least 25 percent, of their owned or leased non-hospital pre-acute or post- acute health care organizations.
Data Sources and Methods
Data are from the 2024 American Hospital Association (AHA) Information Technology (IT) Supplement to the AHA Annual Survey. The 2024 survey was fielded from April to September 2024 and the response rate for non-federal acute care hospitals (N = 2,253) was 51 percent.
Since 2008, ASTP has partnered with the AHA to measure adoption and use of health IT in U.S. hospitals. ASTP funded the 2024 AHA IT Supplement to track hospitals’ engagement in interoperability and exchange, public health reporting, and advanced analytics. The chief executive officer of each U.S. hospital was invited to participate in the survey regardless of AHA membership status. The person most knowledgeable about the hospital’s health IT (typically the chief information officer) was requested to provide the information via a mail survey or secure online site. Non- respondents received follow-up mailings and phone calls to encourage response.
A logistic regression model was used to predict the propensity of survey response as a function of hospital characteristics, including size, ownership, teaching status, system membership, and availability of a cardiac intensive care unit, urban status, and region. Hospital-level weights were derived by the inverse of the predicted propensity.
Data Availability
American Hospital Association (AHA) Information Technology Supplement data are available for purchase from the AHA: https://www.ahadata.com/aha-healthcare-it-database. If you have questions or would like to learn more about the data source or these findings, you may contact ASTP_Data@hhs.gov.
References
- Centers for Disease Control and Prevention. Public Health Data Strategy. Atlanta (GA): Centers for Disease Control and Prevention. Available from: https://www.cdc.gov/public-health-data-strategy/php/index.html
- Centers for Medicare & Medicaid Services. 2024 Medicare Promoting Interoperability Program for Eligible and Critical Access Hospitals. Baltimore (MD): Centers for Medicare & Medicaid Services. Available from: https://www.cms.gov/files/document/2024-pi-program-overview-presentation.pdf
- Centers for Medicare & Medicaid Services. Inpatient Prospective Payment Systems Final Rule. 89 FR 69888, §§ 482.42(e) and 485.640(d). Available from: https://www.federalregister.gov/documents/2024/08/28/2024-17021/medicare-and-medicaid-programs-and-the-childrens-health-insurance-program-hospital-inpatient#p-8188
- Richwine, C. Progress and Ongoing Challenges to Electronic Public Health Reporting Among Non-Federal Acute Care Hospitals. Office of the Assistant Secretary for Technology Policy. Data Brief: 66. 2023. Available from: https://www.healthit.gov/data/data-briefs/progress-and-ongoing-challenges-electronic-public-health-reporting-among-non
- Layden J, Swain M, Brennan N, Tripathi M. Plugging Public Health Data into the Health IT Ecosystem to Protect National Health. NEJM Catal Innov Care Deliv. 2024 Jul 17;5(8):CAT.24.0129. Available from: https://catalyst.nejm.org/doi/full/10.1056/CAT.24.0129
- Metroka AE, Papadouka V, Ternier A, Zucker JR. Effects of Health Level 7 Messaging on Data Quality in New York City’s Immunization Information System, 2014. Public Health Reports®. 2016;131(4):583-587. Available from: https://journals.sagepub.com/doi/10.1177/0033354916662217
- Pew Charitable Trusts. State Public Health Data Reporting Policies and Practices Vary Widely. December 2024. Available from: https://www.pewtrusts.org/-/media/assets/2024/12/state-public-health-data-reporting-policies-and-practices-vary-widely.pdf
Acknowledgements
The authors are with the Office of Standards, Certification, and Analysis, within the Office of the Assistant Secretary for Technology Policy (ASTP). The data brief was drafted under the direction of Mera Choi, Director of the Technical Strategy and Analysis Division, Vaishali Patel, Deputy Director of the Technical Strategy and Analysis Division, and Wesley Barker, Chief of the Data Analysis Branch with subject matter expertise from Rachel Abbey and Molly Prieto.
Suggested Citation
Owusu-Mensah P, Richwine C. Electronic Public Health Reporting Among Non-Federal Acute Care Hospitals. Office of the Assistant Secretary for Technology Policy. Data Brief: 78. July 2025.
Appendix
Appendix Figure A1: Percent of non-federal acute care hospitals engaged in electronic public health reporting, 2021-2024.
Appendix Table A1: Methods used by non-federal acute care hospitals to submit data electronically for core data streams, by hospital characteristics, 2024.
| Immunization registry | Syndromic Surveillance | Electronic lab reporting | Electronic case reporting | |||||||||
|---|---|---|---|---|---|---|---|---|---|---|---|---|
| EHR | HIE | Portal / flat files | EHR | HIE | Portal / flat files | EHR | HIE | Portal / flat files | EHR | HIE | Portal / flat files | |
| National Average | 86% | 19% | 24% | 82% | 18% | 14% | 81% | 19% | 17% | 71% | 16% | 17% |
| Bed Size | ||||||||||||
| Small < 100 (ref) | 81% | 20% | 20% | 77% | 18% | 13% | 76% | 18% | 16% | 65% | 16% | 17% |
| Medium 100 – 399 | 91%* | 18% | 29%* | 87%* | 17% | 16% | 86%* | 21% | 19% | 75%* | 16% | 16% |
| Large > 400 | 92%* | 18% | 26%* | 89%* | 17% | 12% | 89%* | 19% | 17% | 82%* | 20% | 16% |
| Ownership | ||||||||||||
| Non-profit | 88% | 22%* | 18%* | 84% | 21%* | 16%* | 83% | 23%* | 20%* | 74% | 19%* | 18%* |
| For-profit (ref) | 86% | 6% | 63% | 86% | 7% | 7% | 87% | 7% | 8% | 74% | 4% | 8% |
| Government | 79% | 18%* | 17%* | 73%* | 14%* | 13%* | 73%* | 16%* | 13%* | 57%* | 14%* | 19%* |
| Location | ||||||||||||
| Rural | 81% | 22% | 17% | 76% | 20% | 12% | 74% | 20% | 15% | 62% | 16% | 18% |
| Urban | 90%* | 17%* | 28%* | 86%* | 16% | 15% | 86%* | 19% | 19%* | 76%* | 17% | 15% |
| Critical Access | ||||||||||||
| Yes | 79% | 23% | 18% | 74% | 20% | 13% | 72% | 20% | 14% | 60% | 16% | 18% |
| No | 89%* | 17%* | 27%* | 86%* | 16% | 14% | 85%* | 19% | 19%* | 75%* | 16% | 16% |
| System Affiliation | ||||||||||||
| Independent | 79% | 17% | 18% | 73% | 15% | 14% | 71% | 16% | 14% | 55% | 13% | 20% |
| System Member | 89%* | 20% | 27%* | 86%* | 19% | 14% | 86%* | 21%* | 19%* | 78%* | 18%* | 15%* |
| Leading EHR Vendor | ||||||||||||
| No | 84% | 17% | 26% | 80% | 17% | 13% | 78% | 16% | 18% | 62% | 14% | 16% |
| Yes | 88%* | 21%* | 22%* | 85%* | 18% | 15% | 85%* | 23%* | 17% | 79%* | 18%* | 17% |
Notes: *Indicates statistically significant difference at the 5% level. EHR = “Directly from electronic health record system (EHR)”; HIE = Health Information Exchange.
Appendix Figure A2: Percent of hospitals that used a health information exchange (HIE) organization to submit data for at least one type of electronic public health reporting.
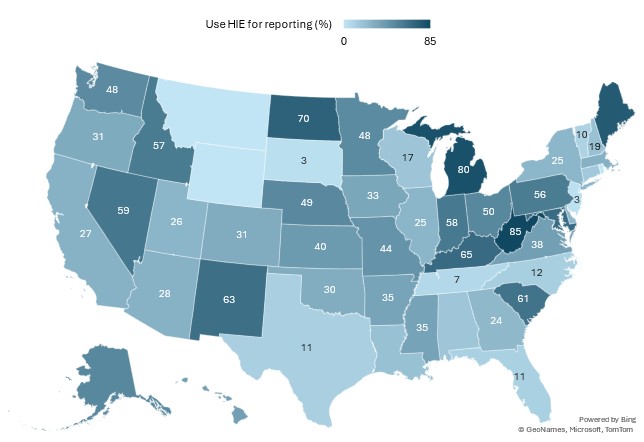
Notes: This figure illustrates the percent of hospitals that used an HIE to submit data for at least one of the 8 types of public health reporting listed in Table 1. Data were redacted for states in which less than 5 hospitals responded to the IT Supplement, or whose response rate was less than 20%.
Appendix Table A2: Percent of hospitals that reported specific challenges to public health reporting, by reporting type, 2024.
| At least one challenge | PHAs lack capacity to receive information | Hospital lacks capacity to send information | Technical complexity | Cost | Different vocabulary standards | Difficulty extracting information from EHR | Onboarding process too cumber-some | No major challenges | |
|---|---|---|---|---|---|---|---|---|---|
| 1. Syndromic surveillance | 51% | 31% | 5% | 29% | 22% | 3% | 7% | 21% | 49% |
| 2. Immunization registry | 49% | 29% | 3% | 24% | 13% | 3% | 4% | 19% | 51% |
| 3. Electronic case reporting | 59% | 35% | 6% | 28% | 17% | 3% | 9% | 23% | 41% |
| 4. Public health registry | 50% | 23% | 8% | 19% | 17% | 6% | 11% | 11% | 50% |
| 5. Clinical data registry | 53% | 23% | 7% | 20% | 16% | 5% | 17% | 12% | 47% |
| 6. Electronic lab reporting | 48% | 19% | 3% | 24% | 13% | 3% | 5% | 20% | 52% |
| 7. Antimicrobial use and resistance | 57% | 10% | 5% | 35% | 20% | 4% | 10% | 19% | 43% |
| 8. Hospital capacity | 46% | 13% | 7% | 17% | 15% | 6% | 12% | 7% | 54% |
| At least one reporting type | 81% | 50% | 14% | 55% | 33% | 14% | 25% | 33% | 19% |
Notes: Missing values are excluded from the denominator for rows 1-8 (missing values were determined by row, i.e., by not selecting any option for a given reporting type). Row 9 indicates the share of hospitals reporting each challenge for at least one reporting type and thus values were treated as missing and excluded from the denominator if missing for all reporting types (N=178). Among hospitals experiencing no major challenges, N=83 had missing data for at least one row in 1-8 but did not report any challenges.
Challenges Key:
| Figure and Table Label | Survey response options for specific challenges |
|---|---|
| PHAs lack capacity | We feel that public health agencies lack the capacity (e.g., technical, staffing) to electronically receive the information |
| Hospital lacks capacity | We do not have the capacity (e.g., technical, staffing) to electronically send the information |
| Technical complexity | Technical complexity of interfaces, transmission, or submission process |
| Cost | Cost related to interfaces, transmission, or submission |
| Different vocabulary standards | We use different vocabulary standards than the public health agency, making it difficult to submit |
| Difficulty extracting information | Difficulty extracting relevant information from EHR |
| Onboarding process | The onboarding process for electronic reporting is too cumbersome |
| No major challenges | Did not experience any major challenges |