
Official websites use .gov
A
.gov
website belongs to an official government organization in the
United States.
Secure .gov websites use HTTPS
A
lock
(
) or
https://
means you’ve safely connected to the .gov website. Share sensitive
information only on official, secure websites.

Hospital Trends in the Use, Evaluation, and Governance of Predictive AI, 2023-2024
No. 80 | September 2025
In the last decade, the use of artificial intelligence (AI) in health care delivery has grown significantly. Predictive AI, which has been used in health care for decades, leverages machine learning to predict future outcomes for applications such as readmission risk prediction, early disease detection, and treatment recommendations1. In the context of broad proliferation of AI in health care, this report examines trends in the foundational use, evaluation, and governance of predictive AI using data from the 2023 and 2024 American Hospital Association (AHA) Information Technology (IT) supplement.
Highlights
- In 2024, 71% of hospitals reported using predictive AI integrated with the electronic health record (EHR), up from 66% in 2023.
- Small, rural, independent, government-owned, and critical access hospitals lagged in their adoption of predictive AI.
- The most common use of predictive AI was to predict health trajectories or risks for inpatients, while the fastest growing uses were to simplify billing and facilitate scheduling.
- Hospitals’ use of predictive AI for billing, scheduling, and identifying high-risk outpatients varied by model source (i.e., EHR-developed, third-party developed, or self-developed models).
- While most hospitals evaluated predictive AI models for accuracy and bias and conducted post-implementation evaluation or monitoring, fewer hospitals did so for all or most of their models.
- Three-quarters of hospitals reported that multiple entities were accountable for evaluating predictive AI at their hospital or health system.
About 7 in 10 hospitals reported using predictive AI in 2024.
Findings
- In 2024, 71% of hospitals reported using predictive AI integrated into their EHR. For the purposes of this study, predictive AI refers to using statistical analysis and machine learning to classify or produce a risk score for individuals (such as readmission risk prediction, early disease detection, appointment no-show, and treatment recommendations).
- Hospitals’ adoption of predictive AI increased significantly in a one-year period, from 66% in 2023 to 71% in 2024.
Figure 1: Non-federal acute care hospitals’ adoption of predictive AI, 2023-2024
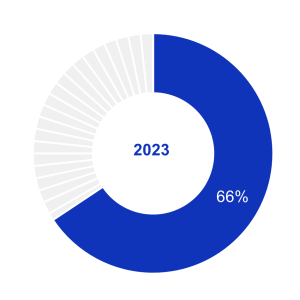
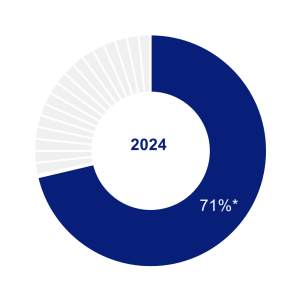
Source: 2023 – 2024 American Hospital Association Information Technology Supplement.
Notes: The denominator represents all non-federal acute care hospitals that provided informative responses to questions on the use of machine learning or other predictive models embedded in or launched by their EHR, n = 2,425 (2023); n = 2,080 (2024). See Appendix Table A1 for survey questions. Missing and do not know responses were excluded from the denominator. *Indicates statistically significant difference relative to 2023 (P<.05).
Hospitals’ use of predictive AI varied by hospital and health IT characteristics.
Findings
- While hospitals’ use of predictive AI increased between 2023 and 2024 for all hospital types, medium, large, urban, system-affiliated, and non-critical access hospitals used predictive AI at higher rates compared to small, rural, independent, and critical access hospitals. For example, system-affiliated hospitals used predictive AI at significantly higher rates than independent hospitals in both 2023 (81% vs. 31%) and 2024 (86% vs. 37%).
- Predictive AI use also varied by EHR vendor: 90% of hospitals using the market leading EHR vendor used predictive AI in 2024 compared to just 50% of hospitals using the other vendors.
Table 1: Differences in non-federal acute care hospitals’ use of predictive AI by hospital characteristics, 2023-2024
| Hospital Characteristics | 2023 | 2024 |
|---|---|---|
| Hospital Size | ||
| Small < 100 (ref) (n=951)† | 53% | 59% |
| Medium 100 – 399 (n=845) | 75%* | 80%* |
| Large > 400 (n=284) | 90%* | 96%* |
| Ownership | ||
| Government (ref) (n=355) | 39% | 44% |
| Non-profit (n=1,503) | 75%* | 80%* |
| For-profit (n=222) | 60%* | 69%* |
| Location | ||
| Rural (n=751) | 48% | 56% |
| Urban (n=1,329) | 77%* | 81%* |
| Critical Access Hospital (CAH) | ||
| CAH (n=559) | 46% | 50% |
| Non-CAH (n=1,521) | 74%* | 80%* |
| System Affiliation | ||
| Independent Hospital (n=460) | 31% | 37% |
| Multi-Hospital System Member (n=1,620) | 81%* | 86%* |
| EHR Vendor | ||
| Market leading vendor (n=1,197) | 87% | 90% |
| All other vendors (n=883) | 48%* | 50%* |
The fastest growing use cases for predictive AI were billing simplification and scheduling facilitation.
Findings
- Hospitals’ use of predictive AI increased significantly from 2023 to 2024 for three use cases: to simplify or automate billing procedures (+25 percentage-points); facilitate scheduling (+16 percentage-points), and identify high risk outpatients to inform follow-up care (+9 percentage- points).
- Hospitals’ use of predictive AI for treatment recommendations increased slightly between 2023 and 2024 (+2 percentage-points). Hospitals’ use of predictive AI for prediction of health trajectories or for inpatient risk remained stable.
Figure 2: Predictive AI use cases among non-federal acute care hospitals that used any predictive AI, 2023-2024
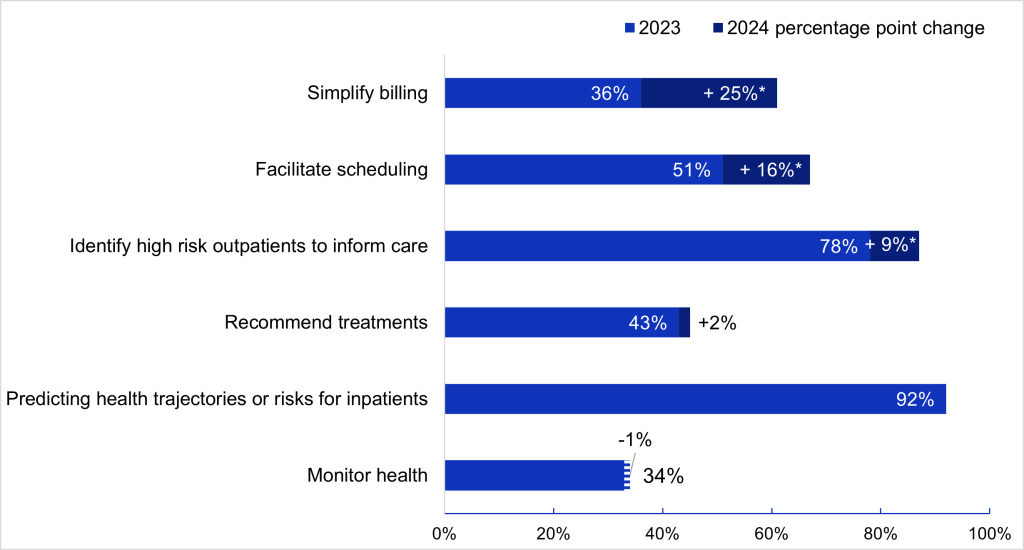
Notes: n = 1,696 (2023); n = 1,587 (2024). Missing values were recoded as ‘No’. Use case labels represent short-hand descriptions of responses to a question asking about use cases for machine learning or other predictive models. Write-in responses to ‘Other (operational process optimization)’ and ‘Other (clinical use cases)’ were excluded from the figure due to variability in interpretation. A full description of use cases is available in Appendix Table A1. *Indicates statistically significant difference relative to 2023 within a corresponding category (P<.05).
Hospitals used predictive AI furnished by their EHR vendors more than AI furnished by third parties or developed in house.
Findings
- In 2024, 80% of hospitals used predictive AI sourced from their EHR developer, 52% used third- party developed AI, and 50% used self-developed AI (see Appendix Figure A1 and Appendix Table A2).
- The use of predictive AI for simplfying or automating billing was higher among hospitals using third-party or self-developed AI (73% collectively) compared to AI sourced from their EHR developer (58%), representing a significant increase (+60 percentage points) from 2024.
- Hospitals’ use of predictive AI to identify high risk outpatients to inform follow-up care increased at higher rates for those using third-party or self-developed AI (+51 percentage points) compared to those using EHR developed AI (-3 percentage points).
- Hospitals’ use of predictive AI to facilitate scheduling increased at higher rates for those using AI sourced from their EHR developer (+19 percentage-points) compared to those using third-party or self-developed AI (+6 percentage points).
Table 2: Predictive AI use cases by AI source among non-federal acute care hospitals, 2023- 2024
| EHR developed AI (80%)† | Other sources only (20%)† | |||
|---|---|---|---|---|
| 2024 | Change from 2023 | 2024 | Change from 2023 | |
| Predicting health trajectories or risks for inpatients | 93%* | -3% | 87%* | +12% |
| Identify high risk outpatients to inform care | 88%* | -3% | 82%* | +51% |
| Monitor health | 37% | -2% | 17% | +3% |
| Recommend treatments | 53% | +2% | 16% | -1% |
| Simplify billing | 58%* | +15% | 73%* | +60% |
| Facilitate scheduling | 67%* | +19% | 65% | +6% |
Notes: n = 1,696 (2023); n = 1,587 (2024). Missing values were recoded as ‘No’. Use case labels represent short-hand descriptions of responses to a question asking about use cases for machine learning or other predictive models. A full description of use cases is available in Appendix Table A1. *Indicates statistically significant difference relative to 2023 within a corresponding category (p<0.05). †AI source (denotes 2024 percentages).
Most hospitals evaluated predictive AI models for accuracy and bias and conducted post-implementation evaluation or monitoring.
Findings
- In 2024, 82% of hospitals evaluated predictive AI for accuracy, 74% for bias, and 79% conducted post-implementation evaluation or monitoring.
- While overall rates of evaluating for model accuracy and bias remained steady from 2023 to 2024, there was a significant increase in the share of hospitals that reported evaluating all or most of their models for accuracy and bias.
Figure 3: Predictive AI evaluation trends among non-federal acute care hospitals, 2023-2024
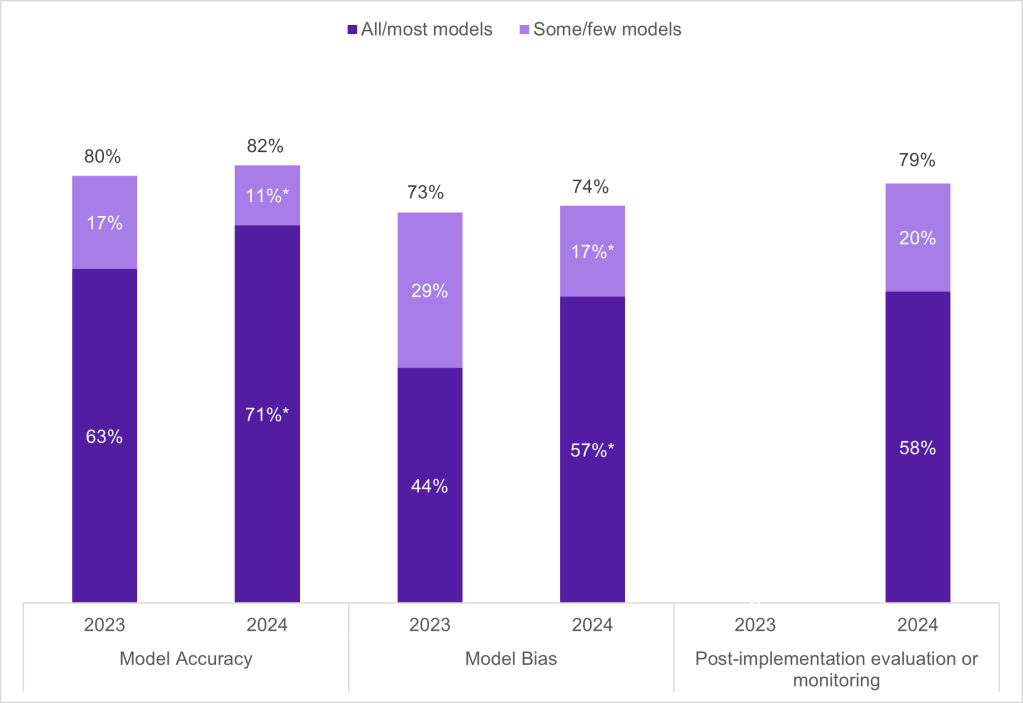
Notes: n = 1,696 (2023); n = 1,587 (2024). Missing values were excluded from the denominator. In 2024, 15% of hospitals reported “don’t know” for evaluating predictive AI models for accuracy, 21% for bias, and 18% for conducting post-implementation evaluation or monitoring. In 2023, post- implementation evaluation or monitoring was not included in the survey instrument. Numbers may not sum to 100% due to rounding. See Appendix Table A1 for survey questions. *Indicates statistically significant difference relative to 2023 within a corresponding category (p<0.05).
In 2024, most hospitals reported that multiple entities at their hospital or health system were accountable for evaluating predictive AI.
Findings
- In 2024, 74% of hospitals indicated that multiple entities were accountable for evaluating predictive AI, with a quarter of hospitals indicating four entities were accountable (Appendix Figure A2).
- A specific committee or task force for predictive AI (66%) and division/department leaders (60%) were the most reported entities responsible for the evaluation of predictive AI. IT staff were the least commonly cited as an entity responsible for evaluation (41%).
Figure 4: Entities accountable for predictive AI evaluation among non-federal acute care hospitals, 2024

Notes: n = 1,696 (2023); n = 1,587 (2024). Missing values were excluded from the denominator. This question was asked for the first time in the 2024 survey. See Appendix Table A1 for survey questions.
Summary
In this brief, we examined trends in the use, evaluation, and governance of predictive AI. We found that adoption of predictive AI in U.S. hospitals increased from 66% in 2023 to 71% in 2024. Despite overall increases in uptake between 2023 and 2024, adoption rates were lower among hospitals that are small, rural, independent, government owned, critical access, and those not using the market leading EHR vendor compared to their counterparts. This early evidence suggests a persistent digital divide in hospitals’ adoption and use of predictive AI.
Beyond an overall increase in the share of hospitals using predictive AI, we observed upward trends in adoption of specific applications of predictive AI. The fastest growing use cases for predictive AI from 2023 to 2024 were for simplifying or automating billing procedures (36% to 61%) and facilitating scheduling (51% to 67%). This parallels the increasing use of generative AI to address administrative processes, reduce burden on staff, and lower operational costs, suggesting spillover effects2, 3. Our data also show that hospitals are increasingly using third-party and self-developed AI for these use cases, accompanied by a slower growth in the adoption of EHR-developed AI for the same purposes. However, it is worth noting that the large changes we see in the use of third-party and self-developed AI are driven, in part, by system-level uptake of AI for specific use cases.
These trends may indicate an active and competitive market for AI-based tools to support administrative tasks, so that organizations are not tethered to the solutions provided by their EHR developer.
The two most common use cases for predictive AI—to predict health trajectories or risk for inpatients and identify high risk outpatients to inform follow-up care—remained high in 2023 and 2024. These common applications are supported by studies demonstrating the use of AI as highly effective in early detection and diagnosis of diseases, improved prediction of disease outcomes, and reduction in readmission rates 4, 5. In contrast, our analysis indicates the use of predictive AI to monitor health and recommend treatments remains relatively low, possibly due to the relatively high risk of errors in their use6. As organizations become increasingly comfortable with AI for non-administrative purposes, these rates may increase.
Multiple organizations have proposed best practices for the use of AI in health care, including evaluating AI models for performance, safety, and fairness 7. With the proliferation of AI in health care settings, many hospitals have used multidisciplinary governance teams to assure that individual applications align with the hospitals’ overall AI strategy. Hospitals reported multiple parties were responsible for evaluating models—three- quarters indicated more than one and more than half indicated three or more (Appendix Figure A2). This approach appears parallel to the governance of quantitative models in the financial services sector, where the best practice is to have three lines of defense: front-line operations, risk management teams, and internal auditors8. However, although hospitals reported multiple parties were responsible, we observed variation in the number and specific parties that hospitals reported were responsible for evaluating AI.
Although there has been an increase in the adoption and use of predictive AI, ongoing challenges persist with AI implementation, including demonstrating real-world performance, engaging the clinical workforce, and meeting medical needs9, 10. In 2024, most hospitals evaluated at least some of their predictive AI models for accuracy, bias, and conducted post-implementation evaluation or monitoring. While overall rates of evaluation remained stable between 2023 and 2024, an increased share of hospitals reported evaluating most or all their models for accuracy and bias, signaling a trend towards more thorough evaluation of deployed models. Medium and large, suburban or urban, system affiliated, non-profit and for-profit, non-critical access hospitals, and those using the market leading vendor, were more likely to report local accuracy and bias evaluation (Appendix Table A3). The National Institute of Standards and Technology recently published an AI Risk Management Framework to ensure that trustworthiness is thoughtfully incorporated into the design, development, use, and evaluation of AI 11, 12. ASTP also publishes SAFER guides that help health care organizations evaluate and improve the safety, effectiveness, and resilience of their EHR systems. As more resources are becoming available to improve AI governance, it will be critical to understand how different frameworks contribute to effective evaluation and monitoring practices.
Definitions
Critical Access Hospital: Hospitals with less than 25 beds and at least 35 miles away from another general or critical access hospital.
Large hospital: Non-federal acute care hospitals of bed counts of 400 or more.
Market leading EHR vendor: Market leading EHR vendor by market share. The market share is based on hospital responses to the 2023 and 2024 survey.
Medium hospital: Non-federal acute care hospitals of bed counts of 100-399.
Non-federal acute care hospital: Hospitals that meet the following criteria: acute care general medical and surgical, children’s general, and cancer hospitals owned by private/not-for-profit, investor-owned/for-profit, or state/local government and located within the 50 states and District of Columbia.
Predictive AI: The application of machine learning and other predictive models that use traditional statistical methods to predict values or events (e.g., likelihood of patient deterioration, need for care, and appointment cancellation/no-shows).
Rural hospital: Hospitals located in a non-metropolitan statistical area.
Small hospital: Non-federal acute care hospitals of bed counts of 100 or less.
System Affiliated Hospital: A system is defined as either a multi-hospital or a diversified single hospital system. A multi-hospital system is two or more hospitals owned, leased, sponsored, or contract managed by a central organization. Single, freestanding hospitals may be categorized as a system by bringing into membership three or more, and at least 25 percent, of their owned or leased non-hospital pre-acute or post- acute health care organizations.
Data Sources and Methods
Data are from the American Hospital Association (AHA) Information Technology (IT) Supplement to the AHA Annual Survey from 2023-2024. Since 2008, ASTP has partnered with the AHA to measure the adoption and use of health IT in U.S. hospitals. ASTP funded the AHA IT Supplement to track hospital adoption and use of EHRs and the exchange of clinical data.
The chief executive officer of each U.S. hospital was invited to participate in the survey regardless of AHA membership status. The person most knowledgeable about the hospital’s health IT (typically the chief information officer) was requested to provide the information via a mail survey or a secure online site. Non respondents received follow-up mailings and phone calls to encourage response.
The 2024 survey was fielded from April to September 2024. The response rate for non-federal acute care hospitals (N = 2,253) was 51 percent. The 2023 survey was fielded from March to August 2023, the response rate for non-federal acute care hospitals (N = 2,547) was 58 percent. A logistic regression model was used to predict the propensity of survey response as a function of hospital characteristics, including size, ownership, teaching status, system membership, and availability of a cardiac intensive care unit, urban status, and region. Hospital-level weights were derived by the inverse of the predicted propensity.
Data Availability
American Hospital Association (AHA) Information Technology Supplement data are available for purchase from the AHA: https://www.ahadata.com/aha-healthcare-it-database. If you have questions or would like to learn more about the data source or these findings, you may contact ASTP_Data@hhs.gov.
References
- Silcox, C., S. Dentzer, and D.W. Bates, AI-enabled clinical decision support software: a “trust and value checklist” for clinicians. NEJM Catalyst Innovations in Care Delivery, 2020. 1(6).
- Henry, T.A. Physicians’ greatest use for AI? Cutting administrative burdens. American Medical Association 2025 June 20, 2025; Available from: https://www.ama-assn.org/practice-management/digital-health/physicians-greatest-use-ai-cutting-administrative-burdens.
- Eddy, N. Healthcare AI adoption up, but data and integration challenges persist. Healhcare IT News 2025; Available from: https://www.healthcareitnews.com/news/healthcare-ai-adoption-data-and-integration-challenges-persist.
- Alowais, S.A., et al., Revolutionizing healthcare: the role of artificial intelligence in clinical practice. BMC medical education, 2023. 23(1): p. 689.
- Tao, J., et al., Predictive Modeling of Hypertension-Related Postpartum Readmission: Retrospective Cohort Analysis. JMIR AI, 2024. 3(1): p. e48588.
- The University of Texas at San Antonio. How AI is Revolutionizing Medical Billing and Coding. Available from: https://www.utsa.edu/pace/news/ai-in-medical-billing-and-coding.html#:~:text=The%20Benefits%20of%20Using%20AI,fewer%20payment%20delays%20and%20denials.
- Parker, V.J., N.J. Economou, and C. Silcox, AI Governance in Health Systems: Aligning Innovation, Accountability, and Trust. 2024, Duke Margolis Institute for Health Policy.
- The Institute of Internal Affairs, The IIA’s Three Lines Model. 2024.
- U.S. Government Accountability Office, Artificial Intelligence in Health Care: Benefits and Challenges of Machine Learning Technologies for Medical Diagnostics. 2022.
- Ryan, R., K. Tallapaka, and C. Lew, AI Is in the Doctor’s Bag—And Primary Care Is Ready to Use It. 2025, Rock Health.
- U.S. Department of Commerce National Institute of Standards and Measures, Artificial Intelligence Risk Management Framework (AI RMF 1.0). 2023.
- U.S. Department of Commerce National Institute of Standards and Measures. Overview of the AI RMF. Available from: https://www.nist.gov/itl/ai-risk-management-framework.
Acknowledgements
The authors are with the Office of Standards, Certification, and Analysis, within the Office of the Assistant Secretary for Technology Policy (ASTP). The data brief was drafted under the direction of Mera Choi, Director of the Technical Strategy and Analysis Division, Vaishali Patel, Deputy Director of the Technical Strategy and Analysis Division, and Wesley Barker, Chief of the Data Analysis Branch with subject matter expertise from Jesse Isaacman-Beck and Jeffery Smith.
Suggested Citation
Chang W, Owusu-Mensah P, Everson J, Richwine C. Hospital Trends in the Use, Evaluation, and Governance of Predictive AI, 2023-2024. Office of the Assistant Secretary for Technology Policy. Data Brief: 80. September 2025.
Appendix
Appendix Table A1: American Hospital Association (AHA) IT Supplement Questions About Predictive AI, 2023-2024
| Question Text | Response Options |
|---|---|
| Advanced Analytics | |
|
Measure: Use Predictive AI Survey Question: Does your hospital use any machine learning or other predictive models that display output or recommendations (e.g., risk scores or clinical decision support) in your EHR or an App embedded in or launched by your EHR? |
In 2023:
In 2024: For each of the following options:
Respondents were asked to select among the following options:
|
|
Measure: Predictive AI use cases Survey Question: To which of the following uses has your hospital applied machine learning or other predictive models? (Please check all that apply.) |
|
|
Measure: Model Source Survey Question: Who developed the machine learning or other predictive models used at your hospital? (Select all that apply.) |
|
|
Measure: Model Evaluation Survey Question: What share of your machine learning or other predictive models have been evaluated using data from your hospital or health system for: |
For each of the following options:
Respondents were asked to select among the following options:
|
|
Measure: Governance Survey Question (2024 only): Who in your hospital or health care system is accountable for evaluating models? (Check all that apply.) |
|
Appendix Figure A1: Predictive AI sources among non-federal acute care hospitals, 2023-2024
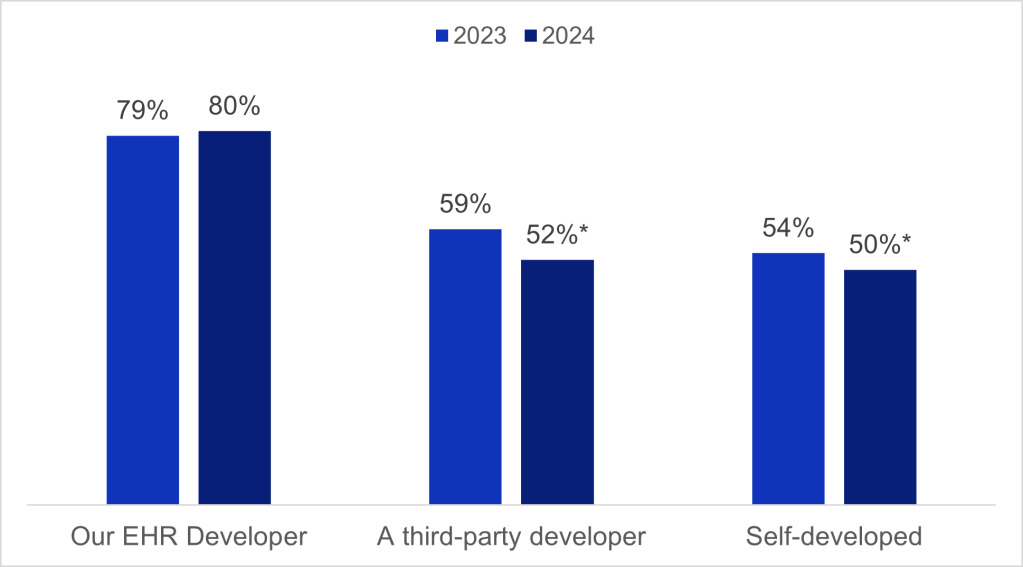
Notes: Missing values were recoded as ‘No’. This figure excludes “public domain” and “don’t know” responses. See Appendix Table A1 for survey questions. *Indicates statistically significant difference relative to 2023 within a corresponding category (P<.05).
Appendix Figure A2: Percentage of the number of entities accountable for predictive AI evaluation, 2024
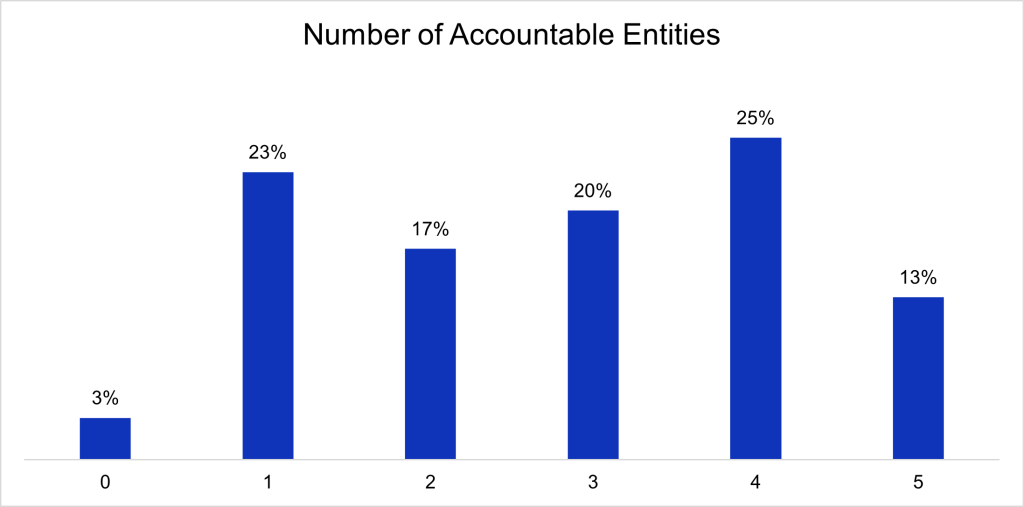
Notes: Missing values were excluded from the denominator. See Appendix Table A1 for survey questions.
Appendix Table A2: Non-federal acute care hospitals’ AI source by hospital characteristics, 2023-2024
| EHR Developer | Third-party | Self-developed | ||||
|---|---|---|---|---|---|---|
| Hospital Characteristics | 2023 | 2024 | 2023 | 2024 | 2023 | 2024 |
| Hospital Size | ||||||
| Small < 100 (ref) (n=951)† | 85% | 85% | 53% | 45% | 49% | 46% |
| Medium 100 – 399 (n=845) | 73%* | 75% | 63%* | 55% | 58%* | 53% |
| Large > 400 (n=284) | 79%* | 79% | 62%* | 64% | 54% | 53% |
| Ownership | ||||||
| Government (ref) (n=355) | 81% | 86% | 27% | 37% | 26% | 35% |
| Non-profit (n=1,503) | 89% | 89% | 59% | 50% | 53% | 54% |
| For-profit (n=222) | 15% | 25% | 85% | 79% | 83% | 43% |
| Location | ||||||
| Rural (n=751) | 86% | 86% | 47% | 38% | 45% | 43% |
| Urban (n=1,329) | 76%* | 77%* | 63%* | 58%* | 57%* | 53%* |
| Critical Access | ||||||
| CAH (n=559) | 91% | 90% | 45% | 36% | 44% | 44% |
| Non-CAH (n=1,521) | 76%* | 77%* | 62%* | 56%* | 56%* | 52%* |
| System Affiliation | ||||||
| Independent Hospital (n=460) | 76% | 82% | 38%* | 40% | 30% | 23% |
| Multi-Hospital System Member (n=1,620) | 79% | 79% | 62%* | 54%* | 58%* | 55%* |
| EHR Vendor | ||||||
| Market leading vendor (n=1,197) | 96% | 90% | 53% | 51% | 50% | 56% |
| All other vendors (n=883) | 52%* | 59%* | 69%* | 54%* | 59%* | 38%* |
Notes: n=2,425 (2023); n=2,080 (2024). Missing values were excluded from the denominator. The top row within each hospital characteristic is the reference group. *Indicates statistically significant difference relative to the reference group (P<.05). †Denotes 2024 sample size.
Appendix Table A3: Non-federal acute care hospitals’ evaluation of predictive AI by hospital characteristics, 2023-2024
| Model Accuracy | Model Bias | Post- implementation evaluation or monitoring | |||
|---|---|---|---|---|---|
| Hospital Characteristics | 2023 | 2024 | 2023 | 2024 | 2024 |
| Hospital Size | |||||
| Small < 100 (ref) (n=951)† | 61% | 65% | 41% | 52% | 53% |
| Medium 100 – 399 (n=845) | 64% | 75%* | 47%* | 61%* | 61%* |
| Large > 400 (n=284) | 65% | 74%* | 45% | 61%* | 65%* |
| Ownership | |||||
| Government (ref) (n=355) | 55% | 53% | 35% | 43% | 48% |
| Non-profit (n=1,503) | 60% | 72%* | 38% | 55%* | 56% |
| For-profit (n=222) | 85%* | 83%* | 85%* | 83%* | 81%* |
| Location | |||||
| Rural (n=751) | 57% | 60% | 37% | 50% | 51% |
| Urban (n=1,329) | 65%* | 75%* | 47%* | 61%* | 62%* |
| Critical Access Hospital (CAH) | |||||
| CAH (n=559) | 59% | 59% | 41% | 47% | 47% |
| Non-CAH (n=1,521) | 63% | 74%* | 45% | 60%* | 61%* |
| System Affiliation | |||||
| Independent Hospital (n=460) | 44% | 41% | 30% | 31% | 38% |
| Multi-Hospital System Member (n=1,620) | 66%* | 76%* | 46%* | 62%* | 62%* |
| EHR Vendor | |||||
| Market leading vendor (n=1,197) | 69% | 80% | 45% | 64% | 63% |
| All other vendors (n=883) | 53%* | 52%* | 42% | 45%* | 49%* |
Notes: n=2,425 (2023); n=2,080 (2024). Missing values were excluded from the denominator. In 2024, 15% of hospitals reported “don’t know” for evaluating predictive AI models for accuracy, 21% for bias, and 18% for conducting post-implementation evaluation or monitoring. The top row within each hospital characteristic is the reference group. *Indicates statistically significant difference relative to the reference group (P<.05). †Denotes 2024 sample size.