
Official websites use .gov
A
.gov
website belongs to an official government organization in the
United States.
Secure .gov websites use HTTPS
A
lock
(
) or
https://
means you’ve safely connected to the .gov website. Share sensitive
information only on official, secure websites.

Electronic Prescribing of Controlled Substances among Medicare Part D Prescribers 2015-2016
No. 44 | April 2019
In 2010, the United States Drug Enforcement Administration (DEA) revised its regulations to allow pharmacies, hospitals, and health care providers to use electronic prescribing of controlled substances (EPCS) technology in all 50 states (1). The use of EPCS technology can help health care providers integrate prescription information into electronic health records (EHRs) more directly, while improving patient safety and reducing diversion and fraud. In October 2018, Congress passed the Substance Use-Disorder Prevention that Promotes Opioid Recovery and Treatment (SUPPORT) for Patients and Communities Act to address the opioids crisis. The SUPPORT for Patients and Communities Act includes a provision requiring prescriptions for controlled substances covered by Medicare Part D to be transmitted electronically starting in 2021 (2). This data brief explores the use of EPCS among Medicare Part D providers on the Surescripts Network from 2015 to 2016. We also present variation in EPCS use and the number of opioid claims prescribed by prescriber specialty and state.
Highlights
- The proportion of Part D prescribers who used EPCS increased by nearly three-fold between 2015 and 2016.
- Part D prescribers with more than 100 opioid claims are twice as likely to use EPCS compared to prescribers that did not have any opioid claims.
- Pain management specialists have the highest proportion of Part D prescribers using EPCS.
- In 2016, 18 states had less than five percent of Part D prescribers use EPCS.
- States with a higher proportion of Part D prescribers using EPCS tend to have lower average number of opioid claims per prescriber.
The proportion of Part D prescribers who used EPCS increased by nearly three-fold between 2015 and 2016.
Figure 1: Percent of Medicare Part D Prescribers who use EPCS on the Surescripts Network, 2015-2016.
- About one in 10 Part D prescribers used EPCS in 2016.
- In 2015 and 2016, Part D opioid prescribers used EPCS at similar rates to all Part D prescribers.
Part D prescribers with more than 100 opioid claims are twice as likely to use EPCS compared to prescribers that did not have any opioid claims.
Table 1: Percent of all Part D prescribers and Part D prescribers that use EPCS by number of opioids claims prescribed through the Medicare Part D Program, 2016.
| Number of Part D Opioid Claims Per Prescriber | Percent of Part D Prescribers | Percent of Part D Prescribers using EPCS |
|---|---|---|
| 0 | 28% | 7% |
| 1 to 10 | 28% | 11% |
| 11 to 99 | 30% | 12% |
| 100 to 199 | 6% | 15% |
| 200 to 299 | 3% | 15% |
| 300 to 499 | 2% | 15% |
| 500 to 999 | 2% | 15% |
| 1000 + | 1% | 16% |
Note: An EPCS prescriber is defined as a Part D prescriber who sent at least one EPCS transaction on the Surescripts Network in a given year. Prescribers with zero Part D opioid claims may still use EPCS technology to prescribe other controlled substances or to prescribe opioids to non-Medicare beneficiaries. This is evident by the seven percent of Part D prescribers who used EPCS but did not have any Part D opioid claims.
- In 2016, about one-quarter of Part D prescribers (28 percent) did not have any Part D opioid claims – less than one in 10 of these providers used EPCS.
- In 2016, about one in seven Part D prescribers (14 percent) had more than 100 Part D opioid claims – about 15 percent of these providers used EPCS.
- Nearly six in 10 part D prescribers (56 percent) had 10 or fewer Part D opioid claims in 2016.
The number of Part D opioid claims per prescriber decreased between 2015 and 2016, regardless of EPCS use.
Figure 2: Average number of Part D opioid claims per Medicare Part D opioid prescriber by use of EPCS on the Surescripts Network, 2015-2016.
- On average, EPCS prescribers had 180 Part D opioid claims per prescriber in 2016 – a six percent reduction from 2015.
- On average, non-EPCS prescribers had 152 Part D opioid claims per prescriber in 2016 – a less than three percent reduction from 2015.
Pain management specialists had the largest proportion of Part D prescribers using EPCS as well as the highest number of Part D opioid claims per prescriber.
Figure 3: Number of Part D opioid prescribers, total number of Part D opioid claims, number of Part D opioid claims per prescriber, and percent of prescribers using EPCS by specialty, 2016.
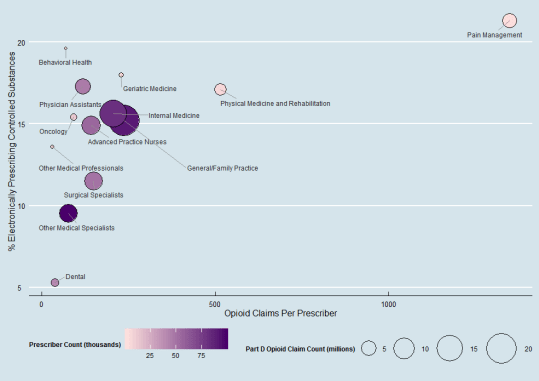
Note: The sample consists of Part D opioid prescribers who prescribed 11 or more Part D opioid claims in 2016. See Appendix Table A1 for the data from this graphic. Specialties were self- reported to CMS. See Appendix Table A2 for a full listing of the specialists defined in each group.
- Specialties with the highest proportion of Part D opioid prescribers using EPCS include pain management, behavioral health, geriatric medicine, physician assistants, and physical medicine and rehabilitation.
- About one in six general/family practitioners and internists who prescribed opioids used EPCS – these specialties represent a large number of providers and the highest total opioid claim count.
- Only 1 in 20 dentists who prescribed opioids in Part D used EPCS.
In 2016, 18 states had fewer than five percent of its Part D prescribers using EPCS.
Figure 4: Percent of Part D prescribers who use EPCS on the Surescripts Network by state, 2016.
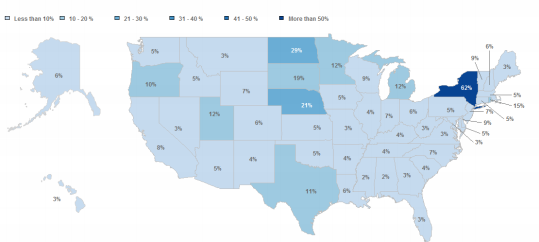
- New York, North Dakota, Nebraska, South Dakota and Rhode Island have the highest proportion of Part D prescribers who use EPCS.
- Alabama, Mississippi, Hawaii, Montana, and West Virginia have the lowest proportion of Part D prescribers who use EPCS.
- In 2016, Minnesota and New York were the only states with a mandatory EPCS requirement.
- In New York, more than six in 10 Part D prescribers used EPCS in 2016.
States with a higher proportion of Part D prescribers using EPCS also had a lower average number of Part D opioid claims per prescriber.
Figure 5: Percent of Part D prescribers who use EPCS on the Surescripts Network compared to average number of Part D opioid claims per prescriber by state, 2016.
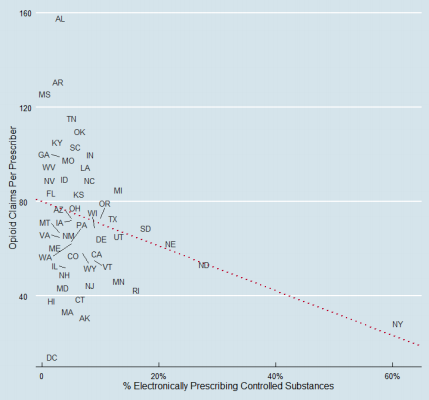
Note: Due to clustering of the data, black lines in the graphic are intended to point the label to the exact location of the data point in the graph. See Appendix Table A3 for the data for this graphic. The fitted line is generated by a linear regression with a slope of -0.95 opioid claims per prescriber for each percent increase in EPCS use. When excluding the state of New York, the slope decreases to -1.36 opioid claims per prescriber for each percent increase in EPCS use.
- New York had the highest proportion of Part D prescribers using EPCS (62%) and the second lowest average number of opioid claims per prescriber (31).
- Alabama had the lowest proportion of Part D prescribers using EPCS (2%) and the highest average number of opioid claims per prescriber (155).
- Washington D.C. had the lowest average number of opioid claims per prescriber (17) and one of the lowest proportions of Part D prescribers using EPCS (3%).
Summary
EPCS has the potential to streamline prescriber workflow, improve medication safety, and enable efficient pain management for patients. Previous research has shown that nearly 90 percent of all non-controlled substances are delivered electronically (3)(4). However, few providers are using electronic methods to prescribe controlled substances. In 2016, only about one in 10 Medicare Part D prescribers used EPCS.
The number of Medicare prescribers using EPCS technology is growing. Between 2015 and 2016, the proportion of Medicare Part D prescribers using EPCS increased nearly three-fold. EPCS users prescribe higher volumes of opioids. In particular, among prescribers with more than 100 Part D opioid claims, the percent of EPCS prescribers was two times higher than providers with no Part D opioid claims. This may indicate that high volume opioid prescribers have a need for using EPCS.
EPCS use varied by health care provider specialty. Pain management specialists had the highest rates of opioid prescriptions and use of EPCS. About one in six family practice and internal medicine prescribers used EPCS. These specialties accounted for the largest total number of Part D opioid claims and also represent specialties with a high number of prescribers. Other specialties with high rates of EPCS use include behavioral health, geriatric medicine, physician assistants, and physical medicine and rehabilitation.
In light of recent EPCS state-level mandates, EPCS use also varied by state. In 2016, New York State implemented an EPCS mandate requiring providers to use EPCS when prescribing controlled substances (5). According to our analysis of 2016 data, New York had the highest rate of EPCS use in the country – 62 percent of Part D prescribers used EPCS in New York compared to the national average of 11 percent in 2016. Additional states, such as Maine and Connecticut, have recently implemented EPCS mandates and seen similar increases in EPCS use (3).
Our descriptive analysis also indicates significant association between the use of EPCS and rates of opioid prescribing among Part D prescribers. States with a high proportion of EPCS users tend to have fewer opioids claims per prescriber. While additional factors besides EPCS use may affect the prescription of opioids, these results highlight the importance of EPCS policies on managing opioid prescriptions. As the SUPPORT for Patients and Communities Act is implemented, we should expect to see an increase in the number of Part D prescribers using EPCS which will help health care providers integrate prescription information into EHRs, while improving patient safety and reducing diversion and fraud.
Definitions
EPCS Prescriber: a Medicare Part D prescriber who sent at least one EPCS transaction on the Surescripts Network in a given year.
Opioid Prescriber: a provider who prescribed 11 or more Medicare Part D opioid claims.
Data Source and Methods
Data are from the Centers for Medicare & Medicaid Services (CMS) Medicare Part D Prescriber Public Use File and the Surescripts Network for the years 2015 and 2016.
The CMS Medicare Part D Prescriber Public Use File presents prescriber-level data for more than one million health care providers that participate in the Medicare Part D program. The file includes information such as National Provider Identifier (NPI), state, provider specialty, drug name, and total claim count. We used the Surescripts Network to identify Part D prescribers who had delivered at least one EPCS transaction in 2015 and 2016.
Surescripts is the nation’s largest health information network, built to increase patient safety, lower costs and ensure quality care. Surescripts connects virtually all electronic health records (EHRs), pharmacy benefit managers (PBMs), pharmacies and clinicians, plus an increasing number of health plans, long-term and post-acute care organizations and specialty pharmacy organizations.
References
1. Interim Final Rule with Request for Comment: Electronic Prescriptions for Controlled Substances. https://www.deadiversion.usdoj.gov/ecomm/ecomm.html
2. Substance Use-Disorder Prevention that Promotes Opioid Recovery and Treatment (SUPPORT) for Patients and Communities Act, Section 2003. https://www.congress.gov/bill/115th-congress/house-bill/6/text
3. Surescripts 2017 National Progress Report. https://www.ehidc.org/sites/default/files/resources/files/Surscripts%202017%20report.pdf
4. Gabriel MH, Swain M. E-Prescribing Trends in the United States. ONC Data Brief, no.18. Washington, DC: Office of the National Coordinator for Health Information Technology, July 2014. 5. New York State Department of Health. Electronic Prescribing. https://www.health.ny.gov/professionals/narcotic/electronic_prescribing/
Acknowledgements
The authors are with the Office of Technology, within the Office of the National Coordinator for Health Information Technology. The data brief was drafted under the direction of Chris Muir, Director of Standards & Technology and Talisha Searcy, Branch Chief of the Data Analysis Branch.
The authors would also like to acknowledge Jaime Smith and Max Sow from Surescripts for their contributions in linking and analyzing the data.
Suggested Citation
Johnson C., Barker W., Pylypchuk Y. & Parasrampuria S. (April 2019). Electronic Prescribing of Controlled Substances among Medicare Part D Prescribers 2015-2016, no. 44. Office of the National Coordinator for Health Information Technology: Washington DC.
Appendix
Appendix Table A1: Percent of Part D opioid prescribers who use EPCS on the Surescripts Network by number of opioid claims per opioid prescriber, 2016.
| Specialty | Part D Opioid Claim Count | Prescriber Count | Part D Opioid Claims per Prescriber | % of EPCS Prescribers |
|---|---|---|---|---|
| General/Family Practice | 21,222,388 | 90,076 | 236 | 15% |
| Internal Medicine | 16,667,536 | 80,822 | 206 | 16% |
| Advanced Practice Nurses | 7,816,135 | 55,356 | 141 | 15% |
| Other Medical Specialists | 7,555,089 | 98,106 | 77 | 10% |
| Surgical Specialists | 7,487,765 | 49,841 | 150 | 12% |
| Physician Assistant | 5,466,469 | 46,305 | 118 | 17% |
| Pain Management | 4,879,442 | 3,618 | 1,349 | 21% |
| Physical Medicine and Rehabilitation | 3,186,552 | 6,187 | 515 | 17% |
| Dental | 1,545,308 | 40,269 | 38 | 5% |
| Oncology | 1,193,453 | 13,031 | 92 | 15% |
| Geriatric Medicine | 589,128 | 2,577 | 229 | 18% |
| Other Medical Professionals | 326,685 | 11,220 | 29 | 14% |
| Behavioral Health | 209,355 | 3,027 | 69 | 20% |
Appendix Table A2: Examples of occupations reported under the defined specialty groupings.
| Specialty Grouping | Reported Occupation |
|---|---|
| Advanced Practice Nurses | Nurse Practitioner, Registered Nurse, Certified Registered Nurse Anesthetist |
| Behavioral Health | Psychiatry, Neuropsychiatry, Addiction Medicine |
| Dental | Dentist, Oral Surgeon |
| General/Family Practice | General Practice, Family Practice, Pediatric Medicine |
| Geriatric Medicine | Geriatric Medicine |
| Internal Medicine | Internal Medicine, General Acute Hospital |
| Oncology | Hematology, Medical Oncology, Radiation Oncology |
| Other Medical Professionals | Pharmacist, Medical Student |
| Other Medical Specialists | Emergency Medicine, Rheumatology, Neurology, Urology, Podiatry |
| Pain Management | Pain Management, Intervention Pain Management |
| Physical Medicine and Rehabilitation | Physical Medicine and Rehabilitation |
| Physician Assistant | Physician Assistant |
| Surgical Specialists | Orthopedic Surgery, Anesthesiology, General Surgery |
Appendix Table A3: Percent of Part D prescribers who use EPCS on the Surescripts Network compared to average number of opioid claims per prescriber by state, 2016.
| State | % of EPCS Prescribers | Average Part D Opioid Claims per Prescriber |
|---|---|---|
| National | 11% | 69 |
| AK | 6% | 34 |
| AL | 2% | 155 |
| AR | 4% | 133 |
| AZ | 5% | 73 |
| CA | 8% | 60 |
| CO | 6% | 60 |
| CT | 5% | 39 |
| DC | 3% | 17 |
| DE | 9% | 67 |
| FL | 3% | 82 |
| GA | 3% | 99 |
| HI | 3% | 37 |
| IA | 5% | 72 |
| ID | 5% | 87 |
| IL | 4% | 52 |
| IN | 7% | 98 |
| KS | 5% | 86 |
| KY | 4% | 108 |
| LA | 6% | 95 |
| MA | 5% | 37 |
| MD | 5% | 47 |
| ME | 3% | 63 |
| MI | 12% | 82 |
| MN | 12% | 49 |
| MO | 3% | 95 |
| MS | 2% | 123 |
| MT | 3% | 67 |
| NC | 7% | 92 |
| ND | 29% | 56 |
| NE | 21% | 65 |
| NH | 6% | 50 |
| NJ | 7% | 47 |
| NM | 4% | 63 |
| NV | 3% | 92 |
| NY | 62% | 31 |
| OH | 6% | 73 |
| OK | 5% | 109 |
| OR | 10% | 73 |
| PA | 5% | 63 |
| RI | 15% | 45 |
| SC | 4% | 101 |
| SD | 19% | 66 |
| TN | 4% | 118 |
| TX | 11% | 70 |
| UT | 12% | 68 |
| VA | 3% | 65 |
| VT | 9% | 55 |
| WA | 5% | 62 |
| WI | 9% | 69 |
| WV | 3% | 95 |
| WY | 7% | 58 |